It’s been a tough few years for renewable resources. A rebound in economic growth after the pandemic led to around a 4% increase in global energy demand. But most of this was supplied by fossil fuels.
With prices spiking and pressure on the supply chain from Russia’s invasion, what does the future hold for green energy?
And what’s the latest data for the amount of the world’s energy that comes from renewable resources?
Key Takeaways:

- Around 30% of the world’s electricity came from renewables in 2021.

- Albania, Iceland, and Paraguay get essentially all of their power from renewable sources.

- Hydropower is the single largest renewable electricity source—producing around 60%.

- Total global wind power capacity now helps the world avoid over 1.2 billion tonnes of CO2 annually. That’s equivalent to saving the annual carbon emissions of South America.

- Geothermal energy covers a significant amount of electricity demand in places that are tectonically active—this includes regions like Iceland, New Zealand, Kenya and the Philippines.
What Are Renewable Resources?
Renewable resources are types of energy that can be regenerated or naturally replenished. This can include:
- Water (hydropower and hydrokinetic)
- Wind (power)
- Solar (power and thermal heating)
- Biomass (traditional and modern)
- Geothermal (power and heating)
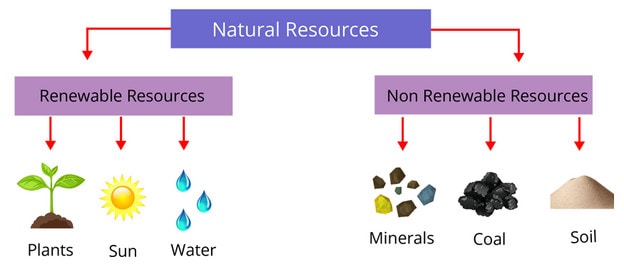
Image credit: Vedantu
While they’re operating, renewable energy sources will fall under one of these brackets for greenhouse gases:
- Zero emissions (e.g. wind, solar, and water)
- Low emissions (e.g. geothermal)
- Neutral (e.g. biomass which is balanced by the amount of carbon dioxide absorbed while growing)
Each resource’s overall environmental impact also depends on factors like manufacturing, installation and land use.
How Much of the World’s Energy Comes From Renewables?
According to the Renewables 2022 Global Status Report, there was “record growth in renewables, but [the] world missed [a] historic chance for a clean energy recovery”.
The International Energy Agency reported that in 2021, renewable energy system generation reached an all-time high. Renewables exceeded 8,000 TWh in 2021. And in 2022, renewables met energy demand increases.
(A watt is a unit of power. A terawatt hour is a unit of energy that expresses the amount of produced energy, electricity and heat).
This was a record 500 TWh above 2020 (even with COVID-19’s impact). However, fossil fuels still accounted for 82% of primary energy use. With the average household using 10,715 kWh per year, there’s a ways to go.
Take Europe, for example. This chart shows what must happen in order to reach the ambitious “Net Zero Scenario” by 2050. Including “a rapid decline in oil and gas consumption” this decade and a cut of more than 50% in oil demand.
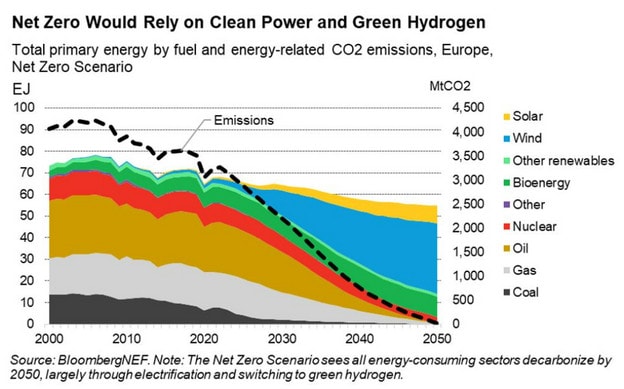
Image credit: World Economic Forum
Between 2019-2021, renewable energy increased by over 8 EJ. (An EJ, or exajoule, is equal to 1018 joules (the standard unit of energy in electronics) = 1,000,000,000,000,000,000.)
https://www.youtube.com/watch?v=BYpZSdSEk4A&ab_channel=StepbyStepScience
The growth of renewable primary energy (including biofuels but excluding hydro) was higher than any other fuel in 2021. It increased by around 5.1 EJ—an annual growth rate of 15%.
Solar and wind capacity also continued to grow rapidly, increasing by 226 GW in 2021 (one gigawatt equals one billion watts). 2020’s record increase was 236 GW.
Emissions from energy rebounded strongly last year—back to around 2019 levels. However, global energy investment is set to reach USD 2.4 trillion in 2022 (8%)—the anticipated rise coming mostly from the clean energy sector.
How Much of the World’s Electricity Comes From Renewables?
Around 30% of the world’s electricity came from renewables in 2021. Unfortunately, CO2 emissions from electricity rose to a record high by almost 7%.
In 2020, 65% of countries generated most of their electricity from fossil fuels, 31% used mostly renewables, and 4% relied on nuclear energy. About 20% of US electricity came from renewable sources.
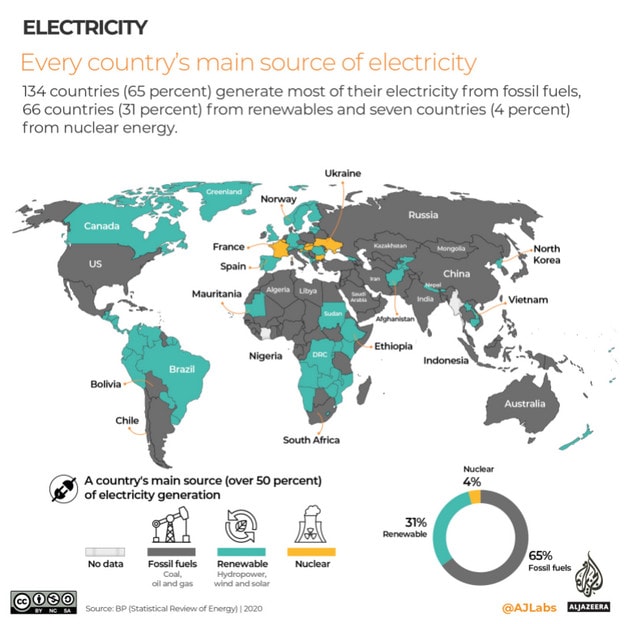
Image credit: Al Jazeera
Albania, Iceland, and Paraguay get essentially all of their electricity from renewable sources.
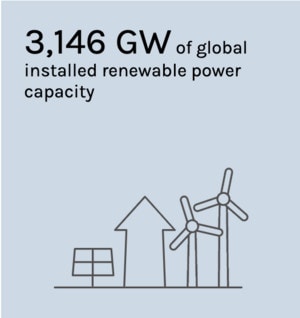
The greatest success for renewables in 2021 was in the power sector—enough renewable energy to power every household in Brazil was added. Installed global renewable power capacity reached a record high of 3,146 GW.
Solar PV and wind accounted for 90%, but we’re still far away from the amount we’d need to reach net zero emissions by 2050. However, investment in solar PV is expected to increase as it becomes the lowest-cost option for new electricity generation in most of the world.
Here’s a graph showing the life-cycle emissions from different electricity options and why the move is so important:
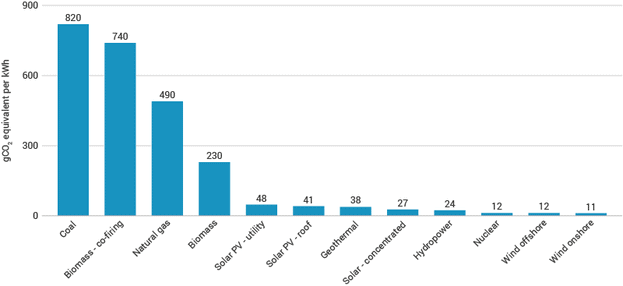
Image credit: World Nuclear Association
How Much of the World’s Air/Water Heating and Cooling Comes From Renewables?
We don’t use enough renewables to heat and cool our homes. Buildings energy makes up around a third of global energy demand, but only 14.7% comes from renewables—a slow 4% increase from the last decade.
However, for the first time in 2020, fossil fuel appliances (like boilers) made up less than 50% of global sales. Renewable heating systems (including electric heat pumps) reached 25%.
A heat pump is a device for warming buildings that transfers thermal energy from outside using a refrigeration cycle. As the heat is already present in the environment, the system itself doesn’t burn any fuel or emit CO2.
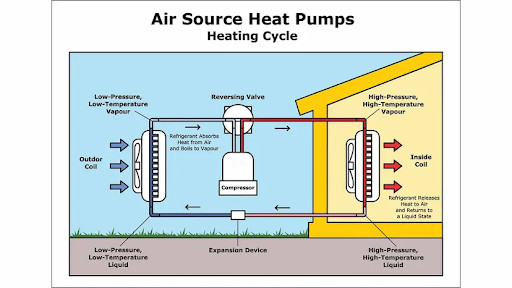
Image credit: HowStuffWorks
While heat pumps accounted for only around 7% of global heating demand in residential buildings, they are becoming more common in newly-constructed buildings.
Global heat pump sales rose by nearly 15% in 2021—double the average of the past decade. 2022 sales are set to hit new records because of the global energy crisis. Annual sales of heat pumps in the EU could rise to 7 million by 2030 if governments manage to hit their emissions reduction goals.
They tend to cost less over their lifetimes than fossil fuel boilers because of their higher efficiency. But the up-front costs of purchasing and installing a heat pump can be 2-4x more than a gas boiler.
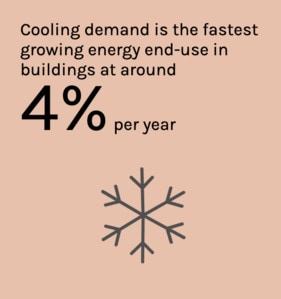
Demand for cooling is also increasing as the global climate gets warmer (by as much as 4% per year).
An estimated 1.1 billion people lack access to cooling—especially in countries like Bangladesh, India and Nigeria. 6 governments have developed national action plans for cooling and 26 are developing them. However, this needs to improve.
What’s the Share of Renewables in the Transportation Sector?
The share of renewables in the transport sector’s final energy consumption only increased by 1.2% (from 2011-2019) to 3.7%. Despite a temporary reduction (due to COVID-19), there’s been a huge 24% increase in demand over the past decade. However, only 28 countries around the world have transport targets for renewable energy.
A record 6.6 million electric cars were sold in 2021—109% more than the year before. Sales of electric buses also grew by more than 40%. However, electric vehicles still only make up around 1% of the global fleet.
Of course, the amount of fossil fuels in the electricity mix for manufacturing and charging electric vehicles will depend on where you are in the world. 64% of China’s electricity generation in 2020 was from coal (compared to 2.9% in the UK).
Despite progression, renewables aren’t making enough of an impact because global systems and infrastructure continue to favor motorized fossil fuel-based transport. Larger shares of the population need to have access to enough convenient and affordable chargers. Governments must get involved by facilitating investment and minimizing barriers to make this possible.
Only 11 countries and 20 cities have a targeted ban on the sales of fossil-fuelled or internal combustion engine (ICE) vehicles.
It’s important to remember, owning an electric vehicle is too expensive and the infrastructure isn’t there yet in most countries to support the ban of other vehicles. Government policies need to catch up and make these accessible to everyone if this is to work in the future.
Types of Renewable Resources & Their Impact
Let’s break down how much of the world’s energy comes from each type of renewable resource:
Water (Hydropower and Hydrokinetic)
Hydropower uses falling or fast-running water to create power. It complements more variable renewables like wind and solar because of its flexibility and storage capabilities—meaning it can help out when there’s no wind or it’s dark and cloudy.
There are four main types of hydropower plants that produce renewable energy:
- Storage: Uses a dam to store water in a reservoir—releasing this water through a turbine activates a generator and produces electricity. These facilities can also be shut down and restarted at short notice (depending on demand) with enough storage capacity to operate independently for weeks or even months.
- Pumped storage: Cycles water between lower and upper reservoirs and uses surplus energy from the system at times of low demand. When demand is high, water is pumped back into the lower reservoir through turbines to produce electricity.
- Run-of-river: Channels a river’s water to spin a turbine through a canal or penstock. These provide a continuous electricity supply with some flexibility for demand fluctuations by regulating water flow (usually limited or no storage capacity).
- Offshore: Uses tidal currents and the power of waves to generate electricity from seawater.
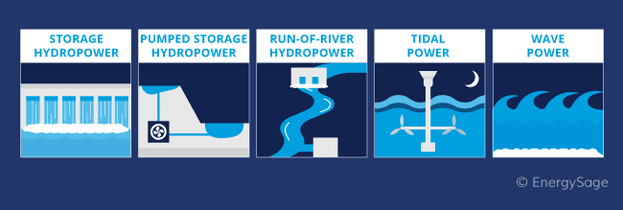
Image credit: EnergySage
Only a small minority of global dams are built for hydropower purposes. The rest are used for things like irrigation, water supply, controlling floods, and other purposes.
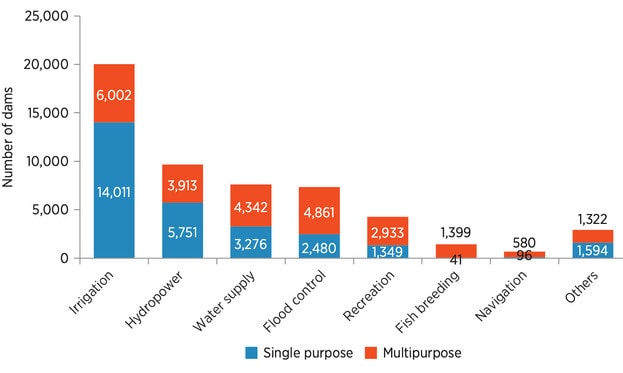
Image credit: IHA
Hydropower is the single largest renewable electricity source—producing around 60%.
In the IEA’s 2021 Hydropower Special Market Report, hydropower accounted for nearly a third of the world’s capacity for flexible electricity supply and has the potential to provide even more.
No country has come close to hitting 100% renewables without hydropower playing a part. It makes up a huge portion of global renewable energy.

Image credit: IHA
Hydropower’s contribution to electricity generation is 55% higher than nuclear’s and larger than wind, solar PV, bioenergy and geothermal combined.
It meets the majority of electricity demand in 28 emerging and developing economies—with a total population of 800 million. Around half of hydropower’s global economically viable potential is untapped. In emerging and developing economies, this is almost 60%.
In North America, the average hydropower plant is nearly 50 years old. In Europe, it’s 45 years old. These facilities have provided affordable and reliable renewable electricity on demand for decades but need modernization to supply secure, sustainable electricity for future generations.
Over a power plant’s life cycle, hydropower results in some of the lowest greenhouse gas emissions per unit of energy generated.
Independent research suggests that using hydropower instead of fossil fuels for electricity over the past 50 years has helped to avoid more than 100 billion tonnes of carbon dioxide being released into the atmosphere. This even exceeds the number of emissions averted by nuclear power. That’s almost the same as the total US annual carbon footprint for 20 years.
Here are the annual figures:
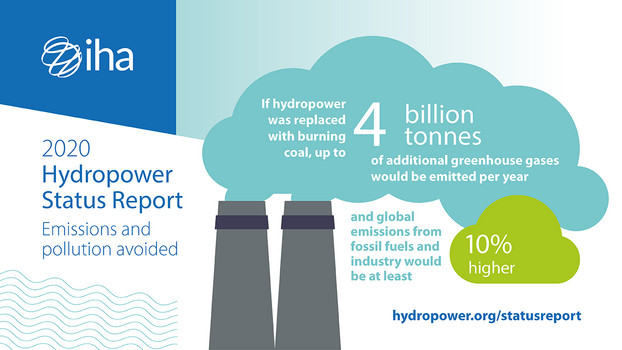
Image credit: IHA
Global hydropower capacity is set to increase by 17% between 2021-2030. However, net capacity additions over this period will be 23% lower compared with the previous decade. China, Latin America and Europe are slowing down projects while Asia Pacific, Africa and the Middle East work to offset these declines.
Hydropower has many benefits, but there are several drawbacks too. Building dams can displace natural habitats and stagnant water can produce greenhouse gases when vegetation underneath rots. It can also impact fish migration and humans in boats if it blocks their route.
Wind
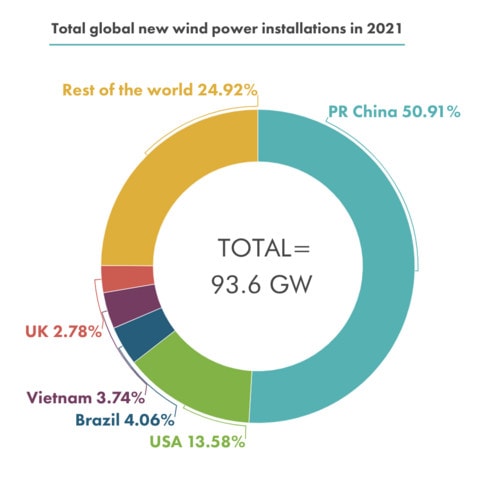
The global wind industry had its second-best year in 2021, with almost 94 GW of capacity added globally (only 1.8% less than 2020’s record growth).
Total global wind power capacity now helps the world avoid over 1.2 billion tonnes of CO2 annually. That’s equivalent to saving the annual carbon emissions of South America.
Europe, Latin America, Africa, and the Middle East had record years for new onshore installations, but total onshore wind installations in 2021 were still 18% lower than 2020. The decline was primarily due to the slow-down of the world’s two largest wind power markets: China and the US.
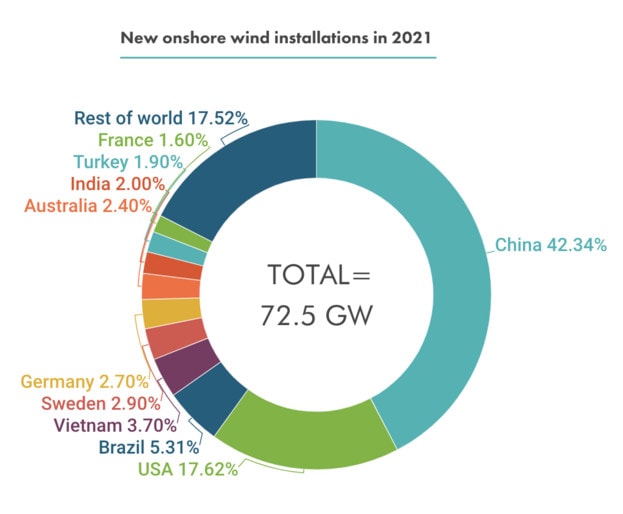
21.1 GW of offshore wind capacity was commissioned last year (3x more than in 2020). That made 2021 the best year in offshore wind history, bringing its market share in global new installations to 22.5%.
China made up 80% of offshore wind capacity added worldwide in 2021, bringing its cumulative offshore wind installations to 27.7 GW. It took three decades for Europe to bring its total offshore wind capacity to a similar level.
Solar (Power and Hot Water)
From 1975 up to 2011, solar panels were a source of global greenhouse gases. But in 2011, things changed. The solar industry stopped being a net source and began avoiding more emissions than it emitted—resulting in a net climate benefit.
Power generation from solar PV increased by a record 179 TWh in 2021—22% more than 2020. It comprised 3.6% of the world’s electricity generation and is the third largest renewable technology behind hydropower and wind.
Companies that invested in solar PV installations on their own buildings and locations were responsible for almost 30% of total installed solar PV capacity (as of 2021.)
A utility-scale facility generates solar power and supplies it to an energy grid. In 2021, utility-scale plants accounted for 52% of increased global solar PV capacity. Residential added 28%, while commercial and industrial segments made up 19%.
Global solar capacity has doubled since 2018, sitting at one terawatt capacity in April 2022. It took almost a decade to reach this level—from 100 GW in 2012. However, SolarPower Europe predicts this number to more than double by 2025.
According to REN21, levelized costs of solar PV (photovoltaic) and onshore wind power are now cheaper than fossil fuels on average.
We estimate that it would cost about $4.5 trillion to power the US entirely with solar energy.
Solar is still the fastest-growing renewable energy resource, making up over half of renewable capacity installed internationally in 2021. With 168 GW of additions, solar installed over 70 GW more than wind. Plus, more than all non-solar renewables combined.
China kept its market leadership in 2021 by adding twice as much solar power capacity than the second-largest US. Despite that, the US added 42% more solar in 2021 than they did in 2020. India also reclaimed third position with 14.2 GW of solar installations.
The worldwide solar thermal market increased by 3% from 2020-2021. The annual energy yield came to 425 TWh, meaning savings of 45.7 million tons of oil and 147.5 million tons of CO2.
109 million solar thermal systems were operating by the end of 2020. By the end of 2021, 530 large-scale documented systems were also in operation.
Biomass
Bioenergy accounts for roughly one-tenth of global total primary energy supply and falls into two main categories:
- Traditional: the combustion of biomass like wood, animal waste, and traditional charcoal.
- Modern: liquid biofuels from bagasse (sugarcane pulp) and other plants, bio-refineries, wood pellet heating systems, etc.
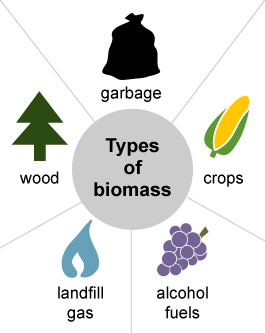
Image credit: Polarpedia
Traditional biomass has negative impacts on the environment and human health. However, this energy source is easily available and fulfills demand for over two billion people living in developing countries.
“Like other combustion fuels, air pollution from burning biomass can cause asthma exacerbations, hospitalizations for heart attack and respiratory disease, birth defects, neurodegenerative diseases and death, among many other health impacts”—Jonathan Buonocore, a research scientist at the Center for Climate, Health, and the Global Environment.
Modern bioenergy is the largest source of global renewable energy—making up 55% and over 6% of global energy supply.
Around 82% of bioelectricity is produced from wood and forestry products (wood pellets), agricultural residues (bagasse is used for 10% of global generation) and solid trash (12%). These fuels are combusted, and the heat drives steam turbines to produce electricity.
Global bio-power capacity more than doubled, and generation rose 88% from 2011-2021.
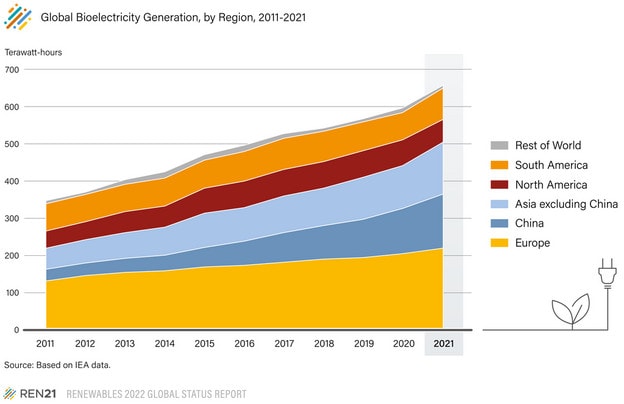
Image credit: REN21
Since 2017, China has been the top producer of biopower. They were followed (in 2021) by the US, Brazil, Germany, Japan, the UK, and India.
Geothermal
Geothermal energy comes from heat generated by the Earth’s core. A little closer to the surface is molten rock called magma. This exists in the mantle and lower crust but sometimes erupts from the surface as lava.
Magma can also heat nearby rocks and underground aquifers. This hot water is released through hot springs, steam vents, underwater hydrothermal vents, and mud pots. These are all sources of geothermal energy.
The heat from these sources can be captured and used directly. Or the steam can be used to generate electricity. Geothermal energy can also be used to heat buildings, parking lots, sidewalks, and other structures.
Here’s how it can work:
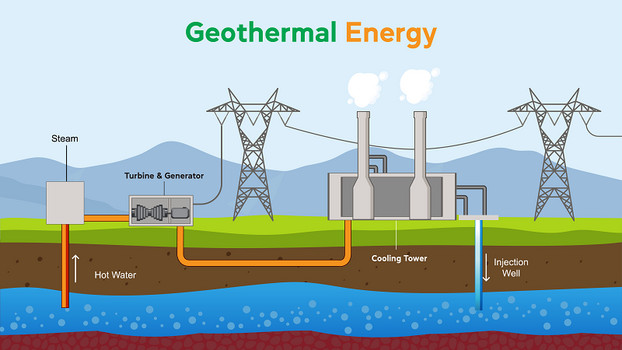
Image credit: Greenesa
Geothermal energy covers a significant amount of electricity demand in places that are tectonically active (areas of the Earth that are strongly affected by the movement of tectonic plates). This includes regions like Iceland, New Zealand, Kenya and the Philippines that can drill wells into existing hydrothermal reservoirs.
Scientists are now even researching the use of geothermal energy from volcanoes. Researchers from the Geological Survey of Canada are currently looking into Mount Meager and Mount Cayley. However, the drilling process is highly expensive, so needs at least a 50% success rate to continue.
Enhanced geothermal systems (EGS) can capture heat from areas that traditional geothermal energy can’t. They can drill deeper into the ground to create artificial thermal reservoirs.
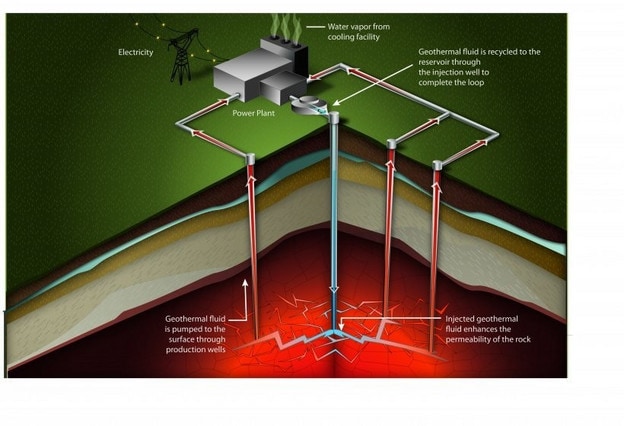
Image credit: World Economic Forum
The US Department of Energy (DOE) estimates that there are more than 5 terawatts of heat resources in the US—enough to meet the energy requirements of the entire world. Apparently, utilizing even a small fraction could power 40 million American homes.
The DOE has also launched the Enhanced Geothermal Shot initiative that aims to cut the cost of EGS by 90% by 2035.
Renewable energy production is growing, but we need to figure out the best ways to store it to help the world decarbonize. New research says geothermal alternatives could be better than existing technologies like batteries for storing excess renewable energy from wind and solar power.
What Does the Future Hold for Renewable Resources?
While the use of renewable resources is definitely increasing, certain industries need to catch up. The COVID-19 pandemic set things back as the use of fossil fuels bounced back to 2019 levels. Unfortunately, green energy didn’t see the same leap.
If we want to see real change, government policies need to start stepping up. But what can we do at home? If you’re wondering how to make more of a personal shift to sustainable living, check out our twice-a-month newsletter. It’s full of helpful tips to make sure we all do our part to protect the longevity of our planet.
Read Next:


